Winds are an important factor influencing the living and non-living components by virtue of their force and magnitude. Winds also play important role of transportation of pollens, seeds, moisture, heat, particulates, gases etc from one place to another. Winds can show diurnal variations (i.e. changeable patterns in daily duration) as well as can have a characteristic long-term pattern. Winds are one of the important weather parameters that possess significance in sectors like agriculture, aviation, navigation in marine and high mountain areas, sailing and meteorology etc.
The study of wind direction and wind speed of an area helps in scientific research, monitoring, predictions, planning, development of urban areas and industries, management of agriculture and other natural resources etc.
Wind speed and wind direction are primary characteristics of winds that one can easily understand through simple and easy observations. Wind Vane is a useful tool to record the direction of wind at a time. To measure the wind speed Cup Anemometer is the simplest device that is used to monitor and calculate the wind speed. Both wind vane and anemometer can be installed together at a place. The ideal sites for taking wind measurements must be open, away from trees, buildings and other structures which can obstruct natural wind movement. If the site is surrounded by trees or buildings, keep the instrument on top a building which is quite away from a tree or structure taller than the one on which it has been kept.
● Wind Vane and anemometer,
● compass
The assembly of wind vane and anemometer can be installed at one place. For recording direction a compass is placed at the base plate of the assembly.
For Wind Direction:
1- Observe the wind vane, the arrow part of it will point to the direction the wind is blowing from. If the arrow is pointing to the east, it means the wind is coming from the east.
2- Monitor the wind vane at different times for observation of direction wind and record the directions.
3- The wind direction is normally observed in eight directions namely East, West, North, South, North East, North West, South East, South West. For more explicit data the directions can be sub-divided further as shown in the figure -

For Wind Speed:
1- In the cup anemometer mark or colour a cup with different colour (for example Red) than other cups.
2- Count the number of times the cup having different colour/mark rotates on its vertical shaft in a time period (duration).
3- Measure the distance travelled by the cup around its axis as follows –
Distance travelled in one round by the cup (D) = R X 2 X 3.14
(Where ‘R’ is the distance of the cup’s centre from the centre of the shaft to which it is attached by a horizontal arm)
4- Record the rounds done by the marked cup in a fixed duration
5- Convert the time in minute or hour and distance in meter or kilometer
You can design a data table to record the wind direction for certain times and another data table to record the observations of wind velocity for certain durations. A sample of data tables with examples of data entry is shown here for example-
Table for recording the wind directions recorded at different times in a day -
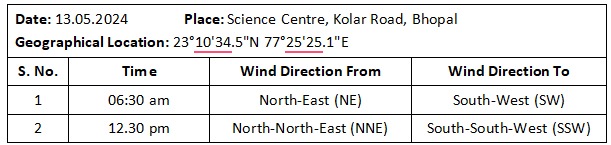
Table for recording the wind speed for different durations -
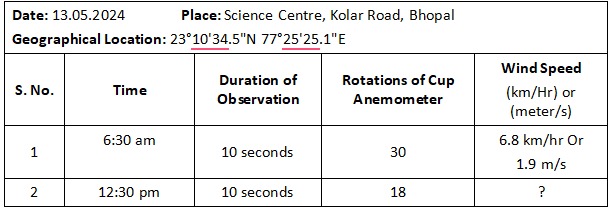
Calculation of Wind Speed –
● Distance travelled in one round by the cup (D) = R X 2 X 3.14
(Where ‘R’ is the distance of the cup’s centre from the centre of the shaft to which it is attached by a horizontal arm)
● If the radius (distance of the cup’s centre from the rotational shaft) is 10 cm then the distance travelled by it in one round = 10 X 2 X 3.14, i.e. 62.8 cm or 0.628 meter.
The wind speed and wind direction can be described both quantitatively as well as qualitatively through different analysis and interpretations.
● Wind speed and wind direction are ever changing phenomenon that influence other weather events as well as our lives significantly.
● Wind vane and anemometer are easy to assemble and portable devices that can be installed at suitable place for short-term / long-term wind monitoring.
● Long-term data of wind speed and wind direction is used in interpreting climate characteristics of an area.
● Study of data for a decade or more can provide us information about wind flow in the area and its impact on ecology and society.
● What are trade winds? How do they occur and what is their significance?
● What are atmospheric winds? Where do they occur? What is their significance?
● How do birds fly from one continent to another through very long distances without getting exhausted with energy?
● Is it possible to install the wind mills at any place? Yes or No, explain.
Windrose: Wind direction and speed recorded over a period of time can be depicted in the form of a diagram called windrose. Windrose is a kind of weather map showing the frequency and strength of winds from different directions. It has immense significance in industrial environmental management, assessment and management of gaseous and particulate pollutants, monitoring of stack / chimney plumes and dispersal of emissions, maritime, aviation, wind energy establishments, agriculture etc.